Can we make geospatial science easier to discover?
That's the question I've been thinking about lately.
I built this interactive visualisation of stormwater drain observations from Bengaluru.
🔗 soniadas123.github.io/blr-swd-game
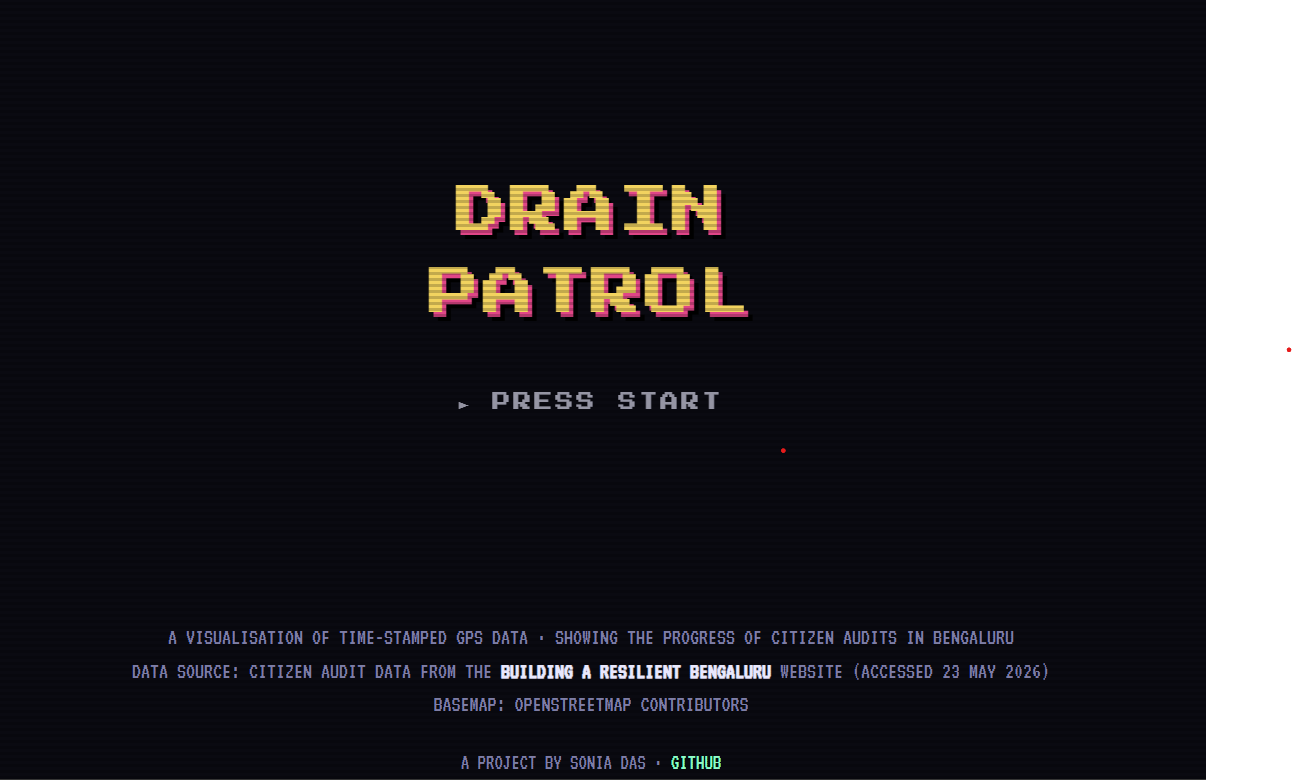
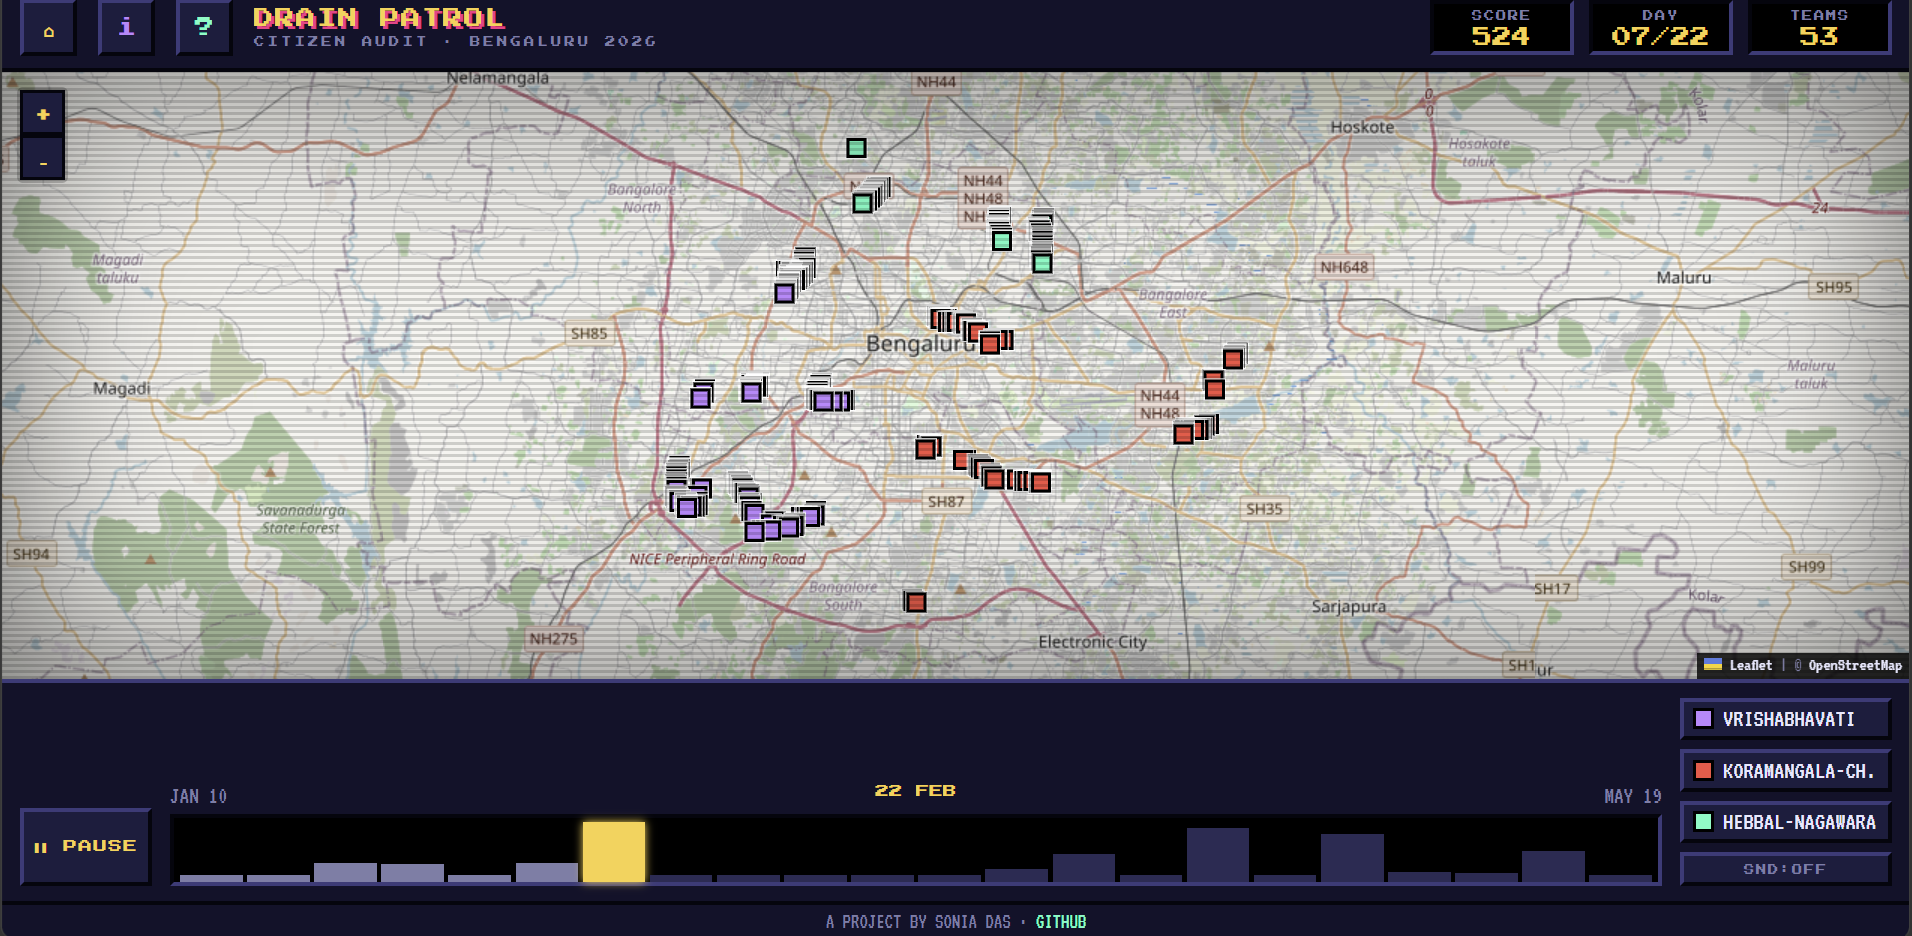
By design, it doesn't explain everything. Instead, it's meant to evoke questions.
- What are these dots?
- Where did they come from?
- How were they collected?
- Why is there a timestamp?
- Why are these observations clustered in certain places?
- Why does a city need this data?
Every dot on the map represents a real observation collected in the field. Behind that simple point are GPS, field surveys, open-source tools like ODK, timestamps, spatial databases, and people working to understand a city.
The visualisation is only the starting point. The real goal is curiosity.
Because I believe that's where spatial thinking begins. Not with software or code, with questions.
If this visualisation made you ask even one question, then it has already done its job.